Posts tagged survey
An Evaluation of Moodle as an Online Classroom Management System
0I’ve finished an evaluation of how our district uses Moodle, and areas where we can improve. You can read the report below.
Over the next few weeks, I’ll be releasing some follow-ups to this evaluation. Addendums, if you will. I was originally planning to supply personal assessments of each participating online course in the initial report, using a rubric for hybrid course design. After some thought I scratched this idea, because much of the rubric falls outside the scope of the district’s objectives for using Moodle, which were included in the report from the outset.
Instead, I will be delivering each a brief mini-report to teachers who participated in the survey (there were 17), with suggestions and recommendations stemming from a combination of the rubric and the survey assessments, tailored specifically to your courses and instruction.
There’s a few things I’ve learned, that I’ll have to remember for the next time we do an evaluation like this.
- Don’t underestimate your turn-out. I was expecting 100, maybe 200 survey participants tops. What I did not expect was receiving 800 survey submissions that I had to comb through and analyze. There were some duplicate data that had to be cleaned up as well, since a few of you got a little “click-happy” when submitting your surveys. I also had to run some queries on the survey database to figure out what some of the courses reported in the student survey actually were, since apparently students don’t always call their courses by the names we have in our system. Since this was a graduate school project, there was a clear deadline that I had to meet, and it was a little more than difficult to manage all that data in the amount of time I had. I should have anticipated that our Moodle-using teachers, being the awesome group they are, would actively encourage all their students to participate in this project. I will not make that mistake again.
- Keep qualitative and quantitative data in their rightful place. Although I provided graphs with ratings on each of the courses, I had to remind myself that these were not strict numerical rankings, as they were directly converted from Likert scaled questions. The degrees between “Strongly Disagree” and “Strongly Agree” are not necessarily the same in everyone’s mind, so when discussing results, one has to look at qualitative differences and speak in those terms. For example, if the collaboration “ratings” for two courses are 3.3 and 3.5 respectively, one can’t necessarily say that people “agreed more” with Course 2 than Course 1. There may be some tendencies that cause one to make that assumption, but one shouldn’t rely on the numerical data alone. To brazenly declare such a statement is hasty. If the difference had been significant, such as 1.5 vs. 4.5, then there would likely be some room for stronger comparisons.
- Always remember the objectives. When analyzing the data, it’s easy to get sidetracked with other interesting, but ultimately useful data. For example, a number of students and teachers complained about Moodle going down. This was a problem awhile ago, and it caused some major grief among people. However, it was not relevant to any of the objectives for the evaluation, even though it was tempting to explain/comment/defend this area. I take it personally when people criticize my servers! (Just kidding.)
- If the questions aren’t right, the whole evaluation will falter. Even though I had the objectives in mind when I designed the survey, I still found it difficult to know which were the right questions to ask. I’ve been assured that this aspect gets easier the more you do it. In the end, there was some extraneous “fluff” that I simply did not use or report on, because it wasn’t relevant (e.g. “Do the online activities provide fewer/more/the same opportunities to learn the subject matter?” My initial inclination was to include this in the Delivery, but when I finally looked at the finished responses, I realized it didn’t really fit anywhere and wasn’t relevant to any of the objectives.
Right now, being the lowly web manager that I am — and I only use the term “web manager” because “webmaster” is so 1990s; I don’t actually “manage” anyone — I don’t get many opportunities to do projects like this. But I’m aspiring to do more as a future educational technologist. Evaluations are more than just big formal projects … they underscore every aspect of what we as educators do. Teachers would do well to perform evaluations of their own instructional practices. When we add new programs or processes in our district, evaluations should accompany them. And as I complained in my mini-evaluation of BrainBlast 2010 a few days ago, all too often the survey data we gather just aren’t properly analyzed and used. We have some of the brightest minds in the state of Utah working in our Technical Services Department, but often we just perform “mental evaluations” and make judgments of the direction things should go, when we would do well to formalize the process, gather sufficient feedback, and use it to make informed decisions.
Update on the Moodle Survey
0 Last week I invited all our Moodle-using teachers and students to take a survey about their usage of Moodle as an online course management system and supplement to in-class instruction. The response has been great. So far (as of November 23, 9:30pm), 652 students and 17 teachers have participated. The survey was supposed to close today, but at the request of the teachers and students, I am leaving it open until November 30.
The survey questions assess four categories: (1) Participant Attitudes, (2) Collaboration, (3) Instructional Preparation, and (4) Instructional Delivery. There are a few goals I’m keeping in mind. One is to help determine the collaborative effect of our usage of Moodle. During the last BrainBlast, we taught a session to (almost) every secondary teacher in attendance: “Creating Collaborators with Moodle.” This begs the question, “Just how well are we currently using Moodle for collaboration?” Where can we improve? Our teachers have had the opportunity to put what they learned in the Moodle class into practice, so has the collaboration aspect improved? The survey addresses this.
Another goal is to address if Moodle actually reduces instructional preparation time. Our teachers have commonly criticized Moodle for being too time-consuming. This is a valid concern, and there are questions addressing the preparation time of the two major activities our teachers use in Moodle: assignments and quizzes. The delivery aspect of Moodle is important, too. Are students more engaged when they use Moodle? Is it easier for them to submit their homework? Does using Moodle save them time as well?
Originally, I was planning on correlating Moodle usage with academic performance, but after consulting with my professor, Dr. Ross Perkins, I realized that there are too many factors involved to even suggest some sort of link between the two. Moreover, the instruction itself is key, not necessarily the tool of delivery. What’s more, I think such a question starts crossing territory into more of a research project than an actual evaluation. It would be incredibly useful to research and establish best practices for online course delivery; the present scholarship in this area is huge and constantly evolving, but a lot of work remains to be done. However, it is outside the scope of this evaluation.
Most of the Moodle survey uses a Likert scale (Strongly Agree to Strongly Disagree) for the questions. There’s considerable debate over whether scales like this should employ a middle ground (e.g. Neither Agree nor Disagree) by providing an odd number of answers, or force participants to choose a position by providing an even number of answers. After tossing the two options back and forth in my mind, I decided on providing a middle option for the questions. I’m wondering now if that was a mistake. I believe it introduces a degree of apathy into the survey that, in hindsight, I didn’t really want. A lot of the participants are choosing “Neither Agree nor Disagree” for some of their answers, when I suspect they probably mean “Disagree.”
Ultimately, though, the data are still valuable. Apparently, most students do not feel that they are given many opportunities to collaborate in Moodle. Teachers generally agree that they don’t bother to provide these opportunities for collaboration. Perhaps as a follow-up, I should ask the teachers why they don’t provide collaborative opportunities, especially those teachers who attended the BrainBlast session.
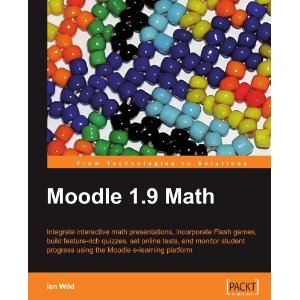
 The data also indicate that both students and teachers generally agree that Moodle saves time in both preparation and instruction. The disagreements here come mainly from math teachers who complain about Moodle’s general lack of support for math questions (DragMath is integrated into our Moodle system, but this isn’t enough), and the inability to provide equations and mathematical formulas in quiz answers. This is undoubtedly worth further investigation. I came across a book on Amazon (Wild, 2009) that may provide some valuable insights.
The participants are prompted to provide open-ended comments as well. Answers fell all across the spectrum, from highly positive (e.g. “I love taking online courses; it’s easy, organized, and efficient…”) to extremely negative (e.g. “I hate everything about it; online schooling is the worst idea for school…”). The diverse answers will be addressed in the final report.
The survey isn’t the only measurement tool I’m using. I’m also going to employ a rubric to assess each online course represented in the survey. There are few enough (in this case, about 20) that this is a reasonable amount to assess within the given time. After that, I just have to write up the final report, create some graphs of the data, analyze the results, and provide recommendations.
References
Wild, I. (2009). Moodle 1.9 Math. Packt Publishing.
